Plotting a single sequence#
This snippet shows how to plot a single sequence of events as an event plot.
First, we import what we will be using throughout the snippet:
[1]:
from thebeat import Sequence, SoundStimulus, SoundSequence
import numpy as np
From a Sequence object#
Plotting Sequence objects is easy. The Sequence class already has a method that does it (plot_sequence()).
As Sequence objects do not contain information about the durations of the events, we use an arbitrary linewidth for the lines. If none is supplied it uses 1/10th of the smallest IOI as the default.
[3]:
seq = Sequence.generate_isochronous(n_events=10, ioi=0.5)
seq.plot_sequence(x_axis_label="Time (s)");  # uses the default linewidth

As you might have noticed in the example above, we passed the plot_sequence method the argument x_axis_label. This is one of the so-called keyword arguments (**kwargs) that can be supplied to most of the plotting functions in this package. For a reference, see e.g. thebeat.helpers.plot_single_sequence().
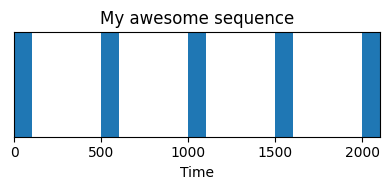
[4]:
seq = Sequence.generate_isochronous(n_events=5, ioi=500)
seq.plot_sequence(title='My awesome sequence', linewidth=100, figsize=(4, 2));
From a SoundSequence object#
SoundSequence objects differ from Sequence objects in that they also contain event durations. So, we do not
have to supply linewidths (though we can), but the linewidths are given by how long the events are.
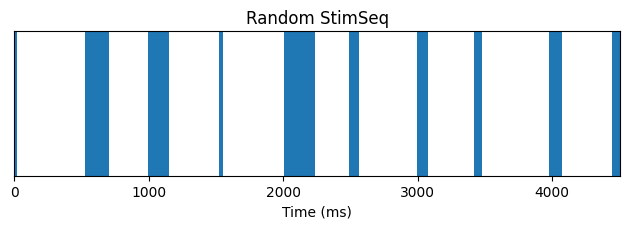
[5]:
# We use a seed to make sure you get the same random output as we
rng = np.random.default_rng(seed=123)

# Let's create 10 stimuli with random durations between 20 and 150 milliseconds
stims = [SoundStimulus.generate(duration_ms=x) for x in rng.integers(low=20, high=250, size=10)]

# Then we create a randomly timed Sequence
seq = Sequence.generate_random_normal(n_events=10, mu=500, sigma=50, rng=rng)

# Create the SoundSequence object
stimseq = SoundSequence(stims, seq)

# And plot!
stimseq.plot_sequence(title='Random StimSeq');
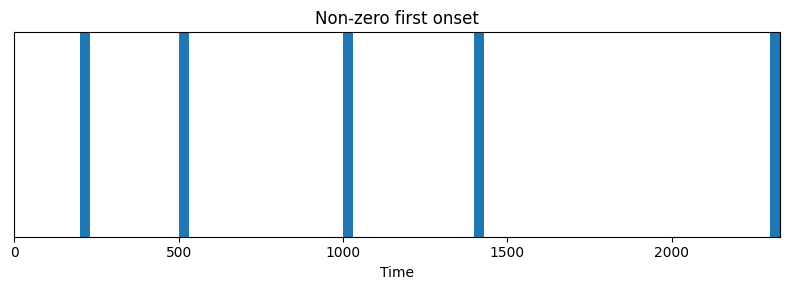
From a list of onsets#
If we want to plot onsets that do not start with zero, we can use the thebeat.core.Sequence.from_onsets() method and then plot.
[6]:
seq = Sequence.from_onsets([200, 500, 1000, 1400, 2300])
seq.plot_sequence(title = "Non-zero first onset", figsize = (8,3));
Adjusting the figure#
Now, of course the standard settings for the plot are great, but what if we want to adjust the plot some more?
The plotting functions and methods used above all return a matplotlib Figure object, and a matplotlib Axes object.
These objects we can manipulate, and then show or save, as in the example below.
[7]:
import matplotlib.pyplot as plt

# Generate isochronous sequence
seq = Sequence.generate_isochronous(n_events=10, ioi=500)

# Use the Sequence.plot() method
fig, ax = seq.plot_sequence(title='My isochronous sequence',
                            figsize=(8, 3))

# Add in some text with a box around it
box_properties = dict(boxstyle='round', facecolor='white', alpha=0.8)
ax.text(3900, 0.8, s="nPVI = 0", bbox=box_properties, fontsize=14)

# Show
plt.show();

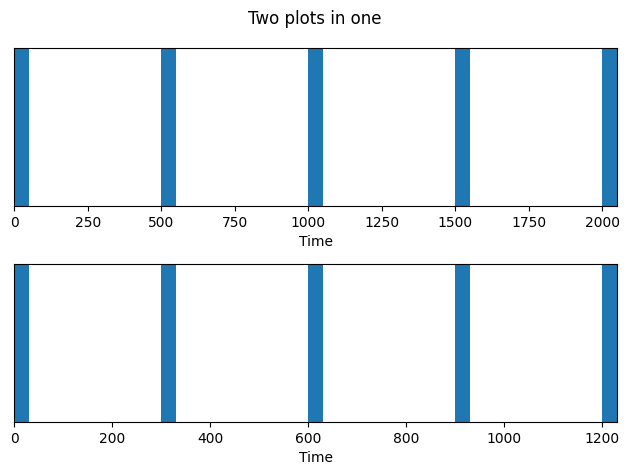
Plotting onto an existing Axes object#
Finally, sometimes it is useful to be able to create a matplotlib Axes and Figure object first, and then use one of the plotting functions of thebeat to plot onto it. This we can do by passing the existing Axes object to the ax parameter. Below is an example. The tight_layout parameter makes sure all the labels are plotted nicely.
[8]:
# Import matplotlib
import matplotlib.pyplot as plt

# Create initial Figure and Axes
fig, axs = plt.subplots(nrows=2, ncols=1, tight_layout=True)

# Create two sequences
seq1 = Sequence.generate_isochronous(n_events=5, ioi=500)
seq2 = Sequence.generate_isochronous(n_events=5, ioi=300)

# Plot onto existing Axes objects
seq1.plot_sequence(ax=axs[0])
seq2.plot_sequence(ax=axs[1])

# Add a title and show
fig.suptitle('Two plots in one')
fig.show()